What is Microsoft Excel, and why is it mostly used?
Microsoft Excel is a spreadsheet programme that uses spreadsheets to arrange data and numbers using formulae and functions. Financial analysis is performed by companies of all sizes using Excel analysis, which is widely used worldwide. Microsoft’s Excel spreadsheet programme is a part of the Office family of business software programs. The Excel boxes are referred to as “cells,” which are arranged in rows and columns. These cells are used to store data. The Microsoft Office and Office 365 suites include Excel, which works with the other Office programs. The spreadsheet application can be used on Windows, macOS, Android, and iOS devices.
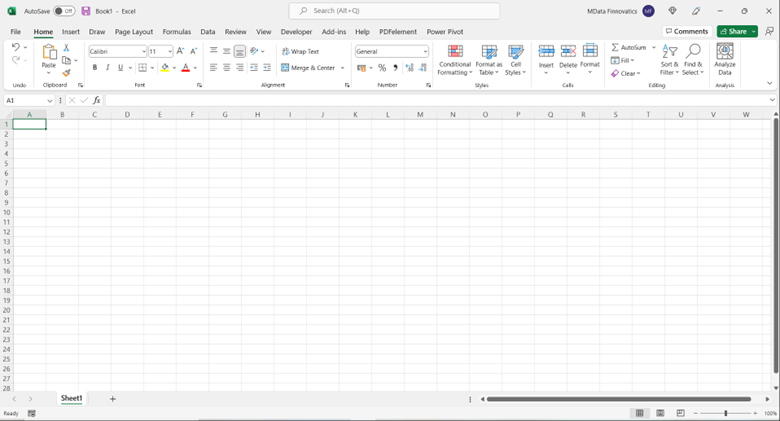
The picture below shows an example of an Excel spreadsheet:
Advantages of MS Excel
MS Excel is used for many different things because it is easy to keep data and add or remove information without much work. Here are a few of the most important reasons for using Microsoft Excel:
- Easy to Store Data: MS Excel makes it easy to save and look at data. This has made it easy for organizations to store databases with a lot of information.
- Easy To Recover Data: If the data is written on paper, it may take longer to find it, but if it’s stored in an Excel spreadsheet, it’s easy to find, locate, and get back just by using the Find and Replace function.
- Mathematical Formulae or Complex Calculations: With the formulas feature of MS Excel, it is now easier and faster to solve mathematical problems. It only takes a few seconds to do the complex calculations.
- Safe and Secure: The information in these spreadsheets is much less likely to get lost than information kept in registers or on paper, and it can be locked on a laptop or desktop computer with a password.
- Database / Data at One Place: In the past, once the paperwork was done, the information had to be kept in different files and registers. Now that you can add more than one worksheet to a single MS Excel file, this is a useful thing to do.
- Data Analytics: It is much simpler to perform analysis on data that has been saved in table format.
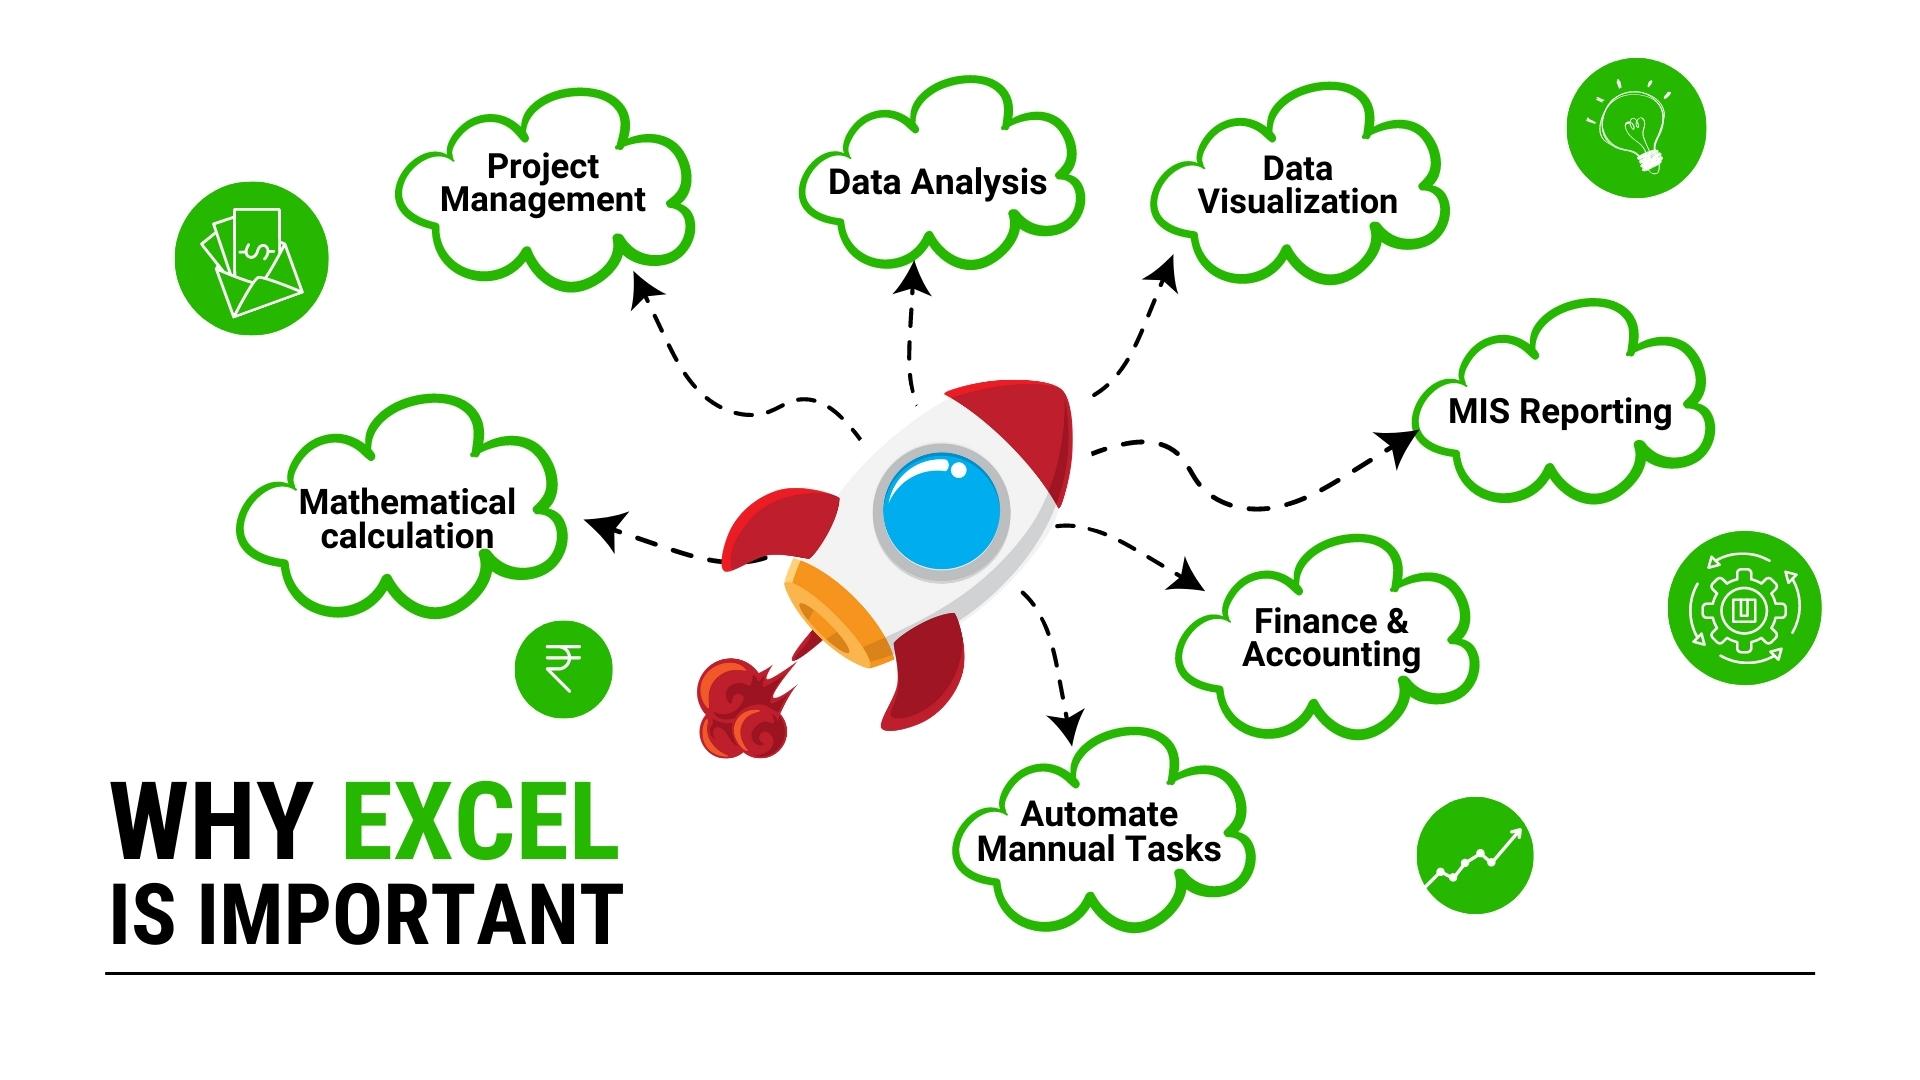
What does Excel do?
Excel is used to look at finances and organize data. It is used by all kinds of businesses and for all kinds of business tasks.
The most common uses for Excel are as follows:
- Easy Data Entry and Storage: Excel makes it very simple to enter and save any kind of data you can think of.
- Data Visualization: All companies save a huge amount of information these days. Excel lets you use charts and graphs to make beautiful, interesting, and dynamic dashboards that make it easy to understand a thousand rows of data in just a few seconds.
- MIS Reporting: MIS Reports, which stand for “Management Information System” Reports, are the reports that need to be made so that management can understand how the business works and how it’s doing so they can take the right steps.
- Automating Manual Tasks: These days, we are living in the age of technology. Everyone wants to reduce their time commitments. Therefore, it is possible to write programs in Excel that will automate the manual tasks that are performed in Excel. For instance, automatically sending emails, generating multiple PDF files, compiling data from hundreds of Excel files, importing, and exporting data from databases, and so on are all examples of what can be done.
- Data Handling: Microsoft Excel is one of the programs that is made to deal with a large amount of numerical data. The user must know how to use formulas and functions so that he or she can easily keep track of the data and get any information from it.
- Accounting and Finance: Microsoft Excel is used by almost all the employees who work in the accounts and finance department to manage the records of their customers. Excel’s intuitive interface makes it simple for managers to use the program to create budgets, carry out forecasting, and figure out variances.
- Analyzing Finances: Microsoft Excel is one of the most important tools for all financial managers and analysts. They spend most of their time making financial models by using financial formulas, calculating valuations and differences, and making graphs and charts. The most common financial formulas are Net Present Value (NPV), Internal Rate of Return (IRR), Present Value (PV), Future Value (FV), Loan Payments (PMT), and many others.
- Project Management: Project managers use Excel to make Gantt charts so they can plan their tasks, assign tasks to different people, keep track of what was done compared to what was planned, make timeline charts, figure out how long projects will take, and so on.
- Customer Relationship Management (CRM): We can use Excel as a small customer relationship management system. We can keep data in different sheets and set up links or relationships between all the tables, which lets us get any record from any sheet. We can make a dashboard that shows the big picture of the data based on the information in all the sheets.