What Can be Done by Microsoft Excel/ Possibilities of Microsoft Excel?
If you are looking for ways to make your business more efficient, one of the best solutions you can use is Microsoft Excel. Excel is a powerful tool, and most of us have almost certainly made use of it either in the workplace or as owners of our own companies. One of the primary advantages of using Excel for business tasks is that it helps save both time and money. This is because Excel offers a wide variety of options for the storage and analysis of data, in addition to features that make it possible to automate Excel to complete time-consuming daily operations. MS Excel is a popular application available through Microsoft Office. The program consists of a spreadsheet that can be utilized to store, as well as perform analysis on, numerical data. You should already know that it’s easy to do data analysis on a spreadsheet made in Excel.
Entering data relating to the future, such as projected investments and significant expenses, into charts and graphs allows one to discover trends and evaluate each possibility. Examples of such data include projected investments and significant expenses. When attempting to forecast the future value of funds that have been invested, trend lines can be illustrated using graphs and charts in Microsoft Excel. Excel is a powerful tool that has established itself in commercial operations all over the world, whether it be for budgeting, organizing customer sales lists, or assessing stocks or issuers. Excel has also established itself as a standard in commercial operations.
MS Excel is often used to keep track of different tasks, efforts, and deadlines, as well as to analyze the schedules of collaborators when planning an event with other people. Users can use the excel sheet as a central database of all the important information that all members need to complete the project.
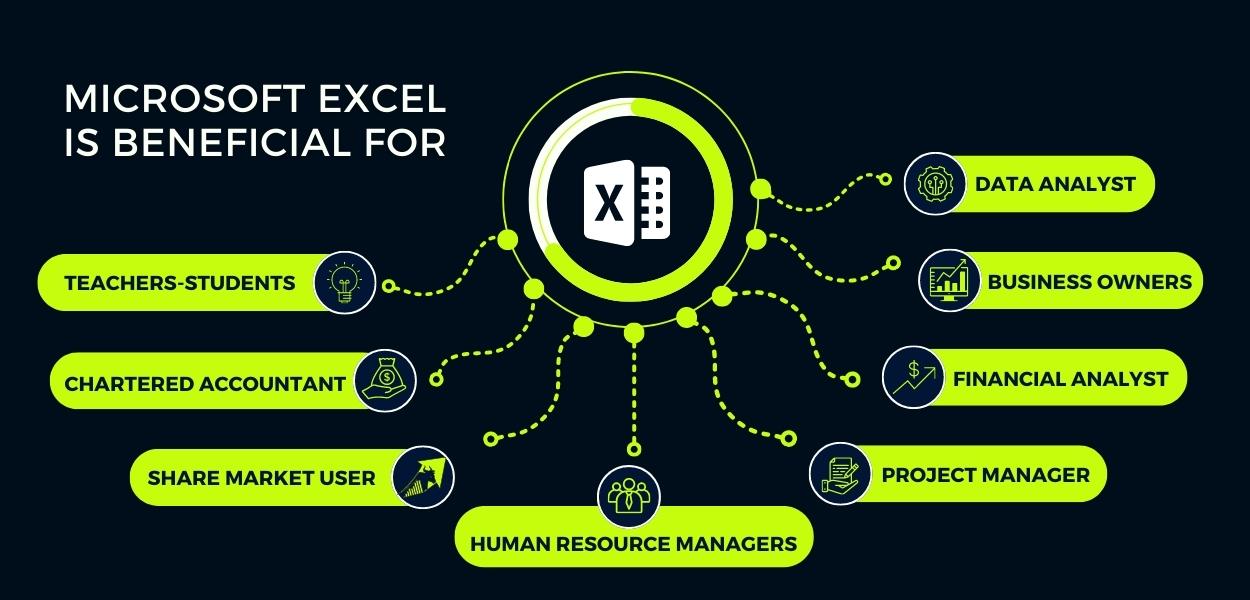
Microsoft Excel is beneficial for whom?
Microsoft Excel is one of the applications that is utilized not only by all companies and all departments, but also by educational institutions such as colleges, universities, and so on. However, we are sharing the roles of individuals who cannot think without Excel. The list is as follows:
- Data Analyst: Microsoft Excel is one of the best data analytics tools in the world, and most data analysts use it. Analysts can easily store, maintain, and modify the data in Excel and use data-cleaning techniques to turn raw data into useful information. They can also make attractive, beautiful, and dynamic dashboards in the form of bars and charts from a large amount of data, which gives management insights on which they can take corrective actions.
- Financial Analyst: The main job of a financial analyst is to make financial decisions for a company based on market trends. They do this by making financial models, evaluating different investment options, and deciding which one will make the most money. Excel is the best tool for making financial models. Analysts can use it to look at past Profit and Loss, Balance Sheets, and Cash Flow statements to make predictions about the future. They can also use different Excel formulas to compare different investment options and choose the best one. Some of the financial formulas are PV, FV, NPV, IRR, XIRR, PMT, and many more.
- Accountant: If you ask any accountant, you’ll find that Microsoft Excel is one of the programs that make their jobs much easier. Accountants use formulas in Excel to do mathematical calculations, Pivot Tables to create any kind of summary of data, Conditional Formatting options to highlight the specific data based on different conditions, charts to make the data more interesting and appealing, Data Validation to create drop-down lists or prevent users from entering wrong information, the What-If-Analysis technique, and many more.
- Project Manager: Project managers are in charge of planning, organizing, and directing the completion of certain projects for an organization. They must make sure that these projects are finished on time, on budget, and without changing the scope of the work. They can use Excel to make Gantt charts, which is an important Excel feature that project managers like to use. They can easily keep track of a project’s start date, end date, rate of completion, name of the resource, and a number of tasks left to do. They can also make visual timeline charts, which makes it easy to manage projects and take corrective actions on time.
- Teachers: Microsoft Excel is a professional program that is taught in schools and colleges these days. Teachers use Excel to keep track of students’ attendance and monthly and yearly grades. They also use Excel to give students homework, make report cards, compare students’ performance, make trend lines to see how students are performing, and so on.
- Students: Excel is used by the students to complete their projects by storing information, plotting charts, performing data analytics by using Excel formulas, and using statistical functions to perform advanced levels of analytics such as regression models, calculating the mean, median, and mode, hypothesis testing, Correlation, Histogram, Description Statistics, ANOVA, and many more.
- Human Resource Manager: Excel is used as a Human Resource management tool that is flexible and cost-effective, making it an ideal choice for small and medium-sized businesses. HR managers utilize Excel for a variety of tasks, including the management of timesheets, keeping employee records, recording employee login and logout times, the maintenance of payroll activities, and the creation of employee salary slips in pdf format.
- Business Owners: Microsoft Excel is a great tool for business owners or people who want to start their own business. Sales and profits are what keep a businessman excited. Using simple Excel formulas, a user can easily figure out the Net Profit from sales and cost data. The user can use Excel functions to make sales forecasts, prepare budgets, compare actual sales to forecasts, calculate variances, make trend lines to see how sales are doing weekly, monthly, quarterly, or annually, and more. Excel is the complete data analytics package for a business owner.
- Share Market Users: Users of the share market can benefit from using Excel to conduct analytics and select the specific stocks in which they should invest their money. They can track the buying and selling of shares, profits, and losses and realized and unrealized amounts. STOCKHISTORY is one of the formulas in Excel that can be used to get historical data about stocks. Excel can also be linked to broker portals so that the live prices of stocks can be shown in Excel. I’ve seen a lot of people set up automation in Excel that tells them which stocks to buy and sell based on linked live data.