Powerful Excel Dashboards for Analytics Professionals
A unique and professional dashboard represents the worth of your brand. Mdata Finnovatics one of the greatest skills is creating interactive design and dynamic dashboards with complex calculations.
If you are looking for Attractive, Interactive, Beautiful and Dynamic Excel Dashboards then you come to the right place!
A picture is worth a thousand words.
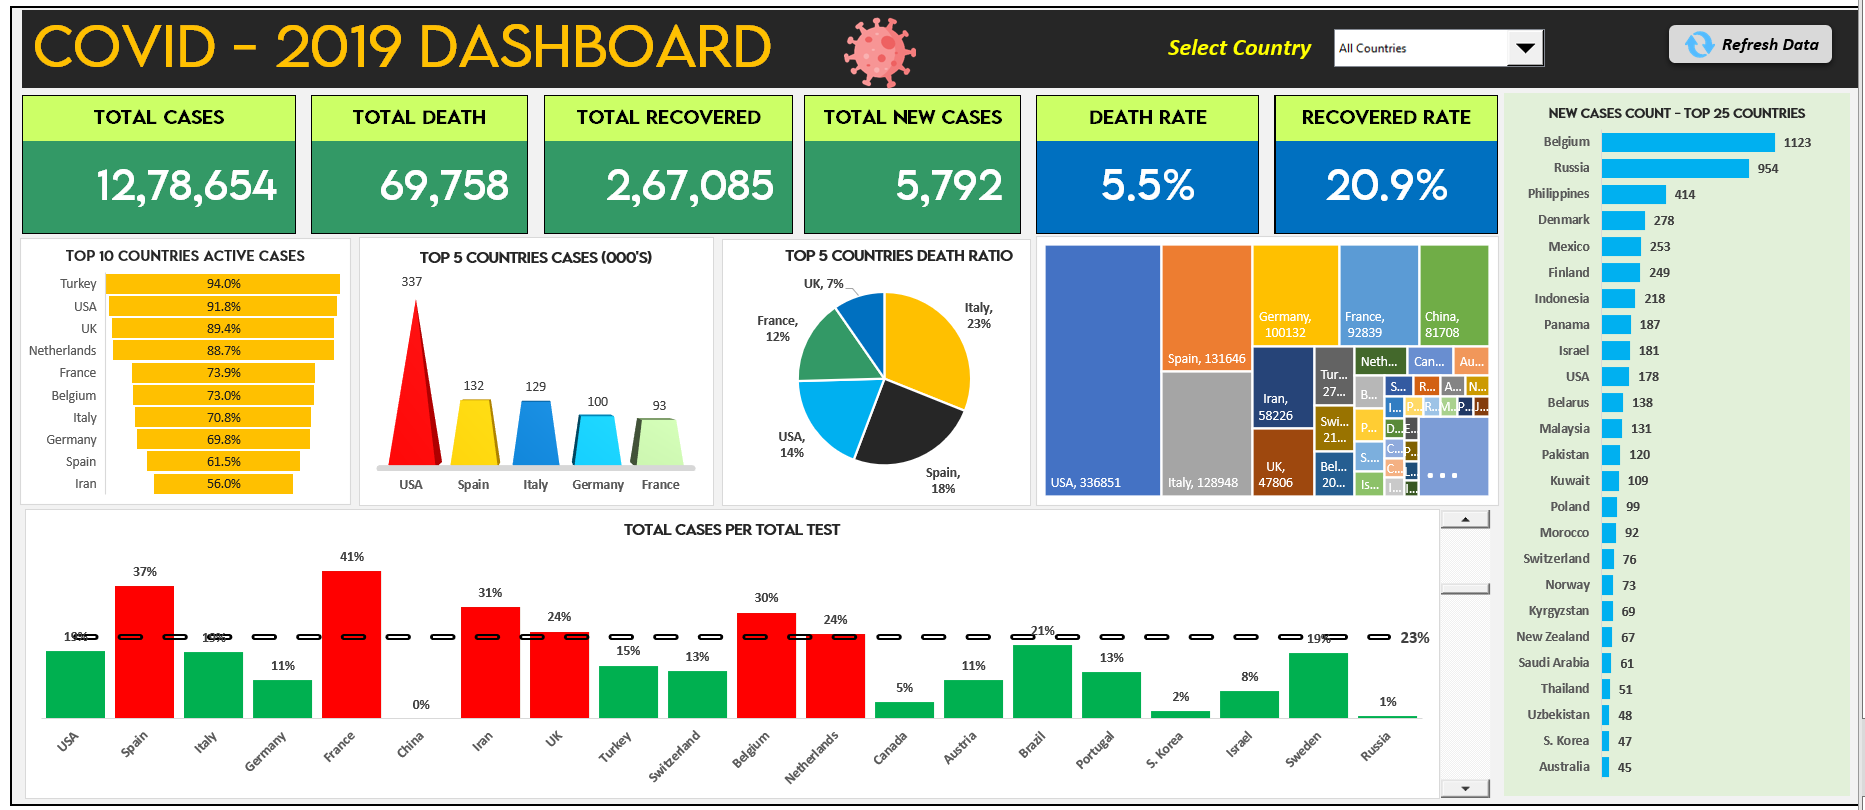
Excel dashboards are graphical representations of key metrics that consolidate all your data in one location for easy viewing and analysis. Users can filter the data to display only the information that is relevant to them using dashboards, which not only provide consolidated data views but also offer an opportunity for self-service business intelligence. Excel reporting frequently required users to generate multiple reports for a variety of individuals or departments based on the information requirements of those entities.
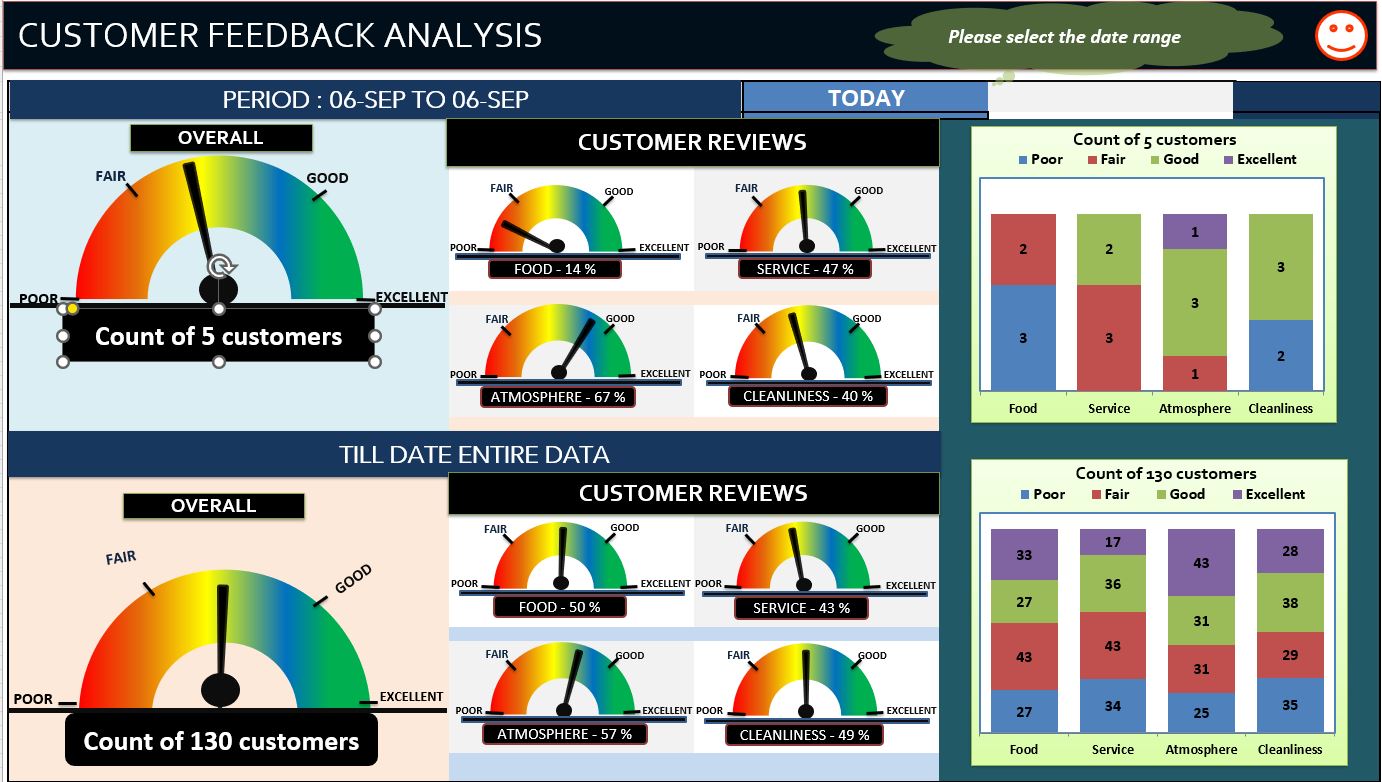
Excel Dashboard
Benefits of Excel Dashboards
Increased Productivity
The use of dashboards makes it possible to evaluate performance using numbers. For instance, the manager of your customer service department could view metrics such as the percentage of calls that are returned, the average amount of time it takes to answer the phone calls, and so on. Importantly, when they see their performance represented numerically, particularly if you use the green and red arrows mentioned above, they will naturally work harder to improve both their performance and their results. This is because seeing their performance represented numerically motivates them.
Provide Real Time Results
Dashboards aggregate and analyze data to provide real-time results. This data is now more manageable and attractive. By presenting real-time data visually, it's easier to see an organization's, team's, or project's performance and spot problems. One advantage of creating a dashboard in Excel is the ability to add or modify data in real time. This software is so simple to use that you can easily add a new product or delete an existing one. Similarly, you can modify the dashboard based on what works best for your company, resulting in outstanding results that lead to sound decisions. It means that everyone in the company can get the level of detail they require to carry out their responsibilities and achieve their objectives.
Better Visibility and Interactivity
Based on the type of data, we can create different graphs and charts in Excel, such as a bar chart, column chart, line chart, pie chart, Pareto chart, histogram, scatter chart, waterfall, funnel, and many more. Excel dashboards provide useful information when it is required. To see changes over time, users can filter the data and interact with charts.
Save Time and Money
Excel Dashboards need to be carefully designed to cover as many KPI metrics as possible. Poorly designed dashboards can make it even more difficult to understand the values and identify the right metrics, whereas well-designed dashboards provide a lot of useful information, can improve the productivity of the company, and can save time which ultimately results in saving money.
Quickly Identify Negative Trends
Excel Dashboard displays a summary of all data in the form of simple graphs and charts. As a result, it is very easy to see where the company is going and to highlight data outliers or negative trends, allowing management to make quick decisions on time.
Improve Decision Making
To gain the best data insights and properly analyze it. Dashboards combine data from multiple sources for a detailed business overview and faster reporting. They show key metrics and KPIs for better decisions and understanding.
We serve to almost every type of Industry
Excel, VBA, and Power BI applications are used in almost every type of industry to store, analyze, and present their data. We serve virtually every type of industry as per their needs.
Medical
Engineering
Education
Banking
Finance
Retailing
Accounting
Manufacturing
Government
Automobile
Why choose Mdata Finnovatics?
Certified Experts
Mdata Finnovatics has experts who are certified by Microsoft and stay up-to-date. They've worked for different companies before, so they can easily figure out what you need and give you the best solutions. They add their own inputs and services that add value based on your industry and tell you what would be best for your business.
Industry Experts
Our experts have more than 10 years of experience in the industry, giving them extensive industry knowledge. Because our experts know a wide range of programming languages and platforms, such as Excel, VBA, Power BI, Python, R Studio, and SQL Server Database, they can give you the best advice for your specific problems.
6 month maintenance period
We never leave our clients in the middle of a project or after it's completed. We offer a 6-month maintenance period, which means that if the customer experiences any problems with what we have delivered in the first six months after the project has been completed, we will fix those problems at no additional cost to the customer.
Delivery in 2 days
We know how important time is, so unless it's a regular or long project, we always do our best to finish projects in two business days. I'm proud to say that 99% of our projects are finished in just 2 days. If the project is going to be behind schedule for any reason, our clients are informed as soon as possible.
Quality Work
One of the main goals of Mdata Finnovatics is to make sure that clients get quality work on time. Before giving the customer the final project, we test it not once but twice to make sure it meets all of their requirements
Free Consulting
"Old is gold." Mdata Finnovatics thinks it's important to keep in touch with their clients over time. So, if a client has been with us for more than a year and has problems with data in their business, we'll give them free consulting four times (once in a quarter) in a year.
No Extra or Hidden Cost
Experts at Mdata Finnovatics first understand your business and your project's needs and requirements. Based on that, they give you a quote. So, you don't have to pay anything beyond the agreed-upon quote if you don't add any new or extra requirements to the project.