Mostly asked Microsoft Excel Interview questions and answers for Data Analyst

One of the crucial data analytics tools that is widely used in businesses around the world is Microsoft Excel. Because of this, employers today demand that their employees be proficient in Excel. The most frequently asked interview questions and their respective responses from Excel interviews for the role of a data analyst are covered in this article, which will improve your knowledge and assist you in excel interview processes.
So, lets begin with Excel interview questions and answers.
1. What is Data Analytics?
Data Analytics is a combination of 2 words: Data + Analytics
Data means Information.
Analytics means analyzing something based on which interpretation and insights can be given.
So, Data Analytics is the process of analyzing and doing a detailed study on the given information so that meaningful insights can be given which helps in decision making.
2. What are the top 5 tools used for Data Analytics?
The top 5 and most used data analytics tools are:
- Microsoft Excel (Launched by Microsoft in 1985)
- Python and R Programming (Python invented by Guido van Rossum in late 1980’s and R programming designed by Ross Ihaka and Robert Gentleman in early 1990’s)
- Power BI (Officially released by Microsoft in 2015)
- Tableau (Tableau was created by Pat Hanrahan, Christian Chabot, and Chris Stolte in 2003 and Tableau was acquired by Salesforce in 2019)
- SAS (SAS was founded by Jim Goodnight in 1976. SAS is a part of SAS Institute Inc.)
3. What is the extension of macro files? or Can I save macro files in xlsx format?
The macro files should be saved in .xlsm or .xlsb format.
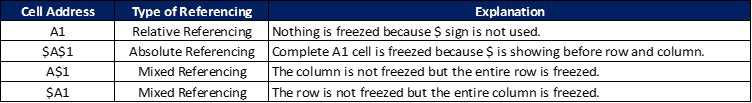
4. What is cell referencing and what is the difference between Absolute and Relative cell referencing?
In Excel, cell referencing is the concept which is used to keep the formulas static or dynamic.
There are 3 types of cell referencing in excel: Absolute, Relative, and Mixed Referencing
Relative Referencing: It is the default referencing in excel where the formula is working dynamically. If formula copied from one cell and pasted to the different cell(s), the relative positions of rows and columns will change accordingly. For example – A1
Absolute Referencing: This referencing is used if the user doesn’t want to change the cell reference in the formula in any way. This will keep the rows and columns value constant. To apply the absolute referencing, dollar sign ($) is used before row and column. For example – $A$1
Mixed Referencing: It is a part of absolute referencing. If the user wants to fix only a column or a row, then will call it mixed referencing. For example – $A1 or A$1
5. In Excel, how to calculate your age in years from the current date?
Most of the users don’t know that DATEDIF is one of the important formulas in excel.
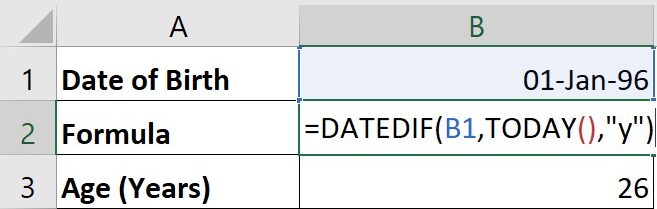
DATEDIF formula is used to calculate the difference between any 2 dates in terms of years, months, days.
Syntax = DATEDIF(Start_Date,End_Date,Interval)
There is a long list of Intervals. Few of them are:
Y = Years
M = Months
D = Days
YM = Years + Months
YD = Years + Days
And many more….
Click here to watch How to calculate Age in Excel (Hindi)
6. What is the difference between Excel 365 and Excel Perpetual (2019,2016,2013….) versions?
An Excel perpetual license is a type of software license that permits a user to use a specific version of a program. Excel is available with a variety of perpetual licenses, including Excel 2019, Excel 2016, Excel 2013, and more. These are license-based programs, which the user can purchase once and use for the rest of his life. Microsoft add new features to the latest versions of Excel that are not present in earlier versions.
Excel 365 works on a subscription-based model. This means that depending on the type of subscription he chose, the user must pay a regular amount either monthly or yearly to use Excel 365. The benefit of using Excel 365 is that all the updated, most recent features are automatically included, so there is no need to purchase a license for the new versions
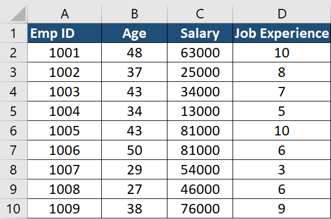
7. What is the output of the below formula?
=SUMIFS(D1:D10,B1:B10,”>=35″,C1:C10,”>54000″)
Show answer ➜➜Hide answer
8. The Function SUMIF can be always replace the function SUMIFS
TRUE
FALSE
9. Write Excel Formula to calculate the Average Salary of all employee whose age is more than 50
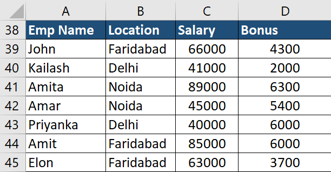
10. What is the output of the below formula?
=VLOOKUP(“Amit”,$A$38:$D$45,3,FALSE)
11. What is the output of the below formula?
=CONCATENATE(“Mdata”,” Finnovatics”)
12. What is conditional Formatting and how to apply in Excel?
Conditional Formatting is an essential Excel concept that allows us to apply formats to cells and highlight a list of cells based on a condition or scenario.
For example: Highlight the entire row in green if the project’s status is Completed, yellow if it’s In Progress, and red if it’s Not Started.
Conditional Formatting Shortcut: ALT + H + L + N
Conditional Formatting Navigation: Home Tab > Styles Section > Conditional Formatting > New Rule
13. What are the most used functions in Excel that a Data Analyst should be familiar with?
Excel has over 300 functions and knowing them all is difficult. The following are a few formulas that every Data Analyst should be familiar with:
Logical Functions: IF, AND, OR, IFERROR
Text Functions: CONCAT, LEFT, RIGHT, FIND, LEN, TRIM, TEXT
Lookup Functions: VLOOKUP, HLOOKUP, INDEX, MATCH, INDIRECT, OFFSET, XLOOKUP
Date Functions: DATE, EOMONTH, NETWORKDAYS, TODAY, WEEKDAY, WEEKNUM
14. How will you find duplicate values in a specific column?
There are 2 ways of finding the duplicate values which are given below:
Conditional Formatting: Use this feature to highlight data where duplicate entries exist.
Function: Use the COUNTIF Excel function to calculate the count. If the count is more than 1, it means there is a duplicate value in that range.
15. What is the difference between COUNT and COUNTA function?
COUNT function counts the number of cells in a range that contains only numbers.
COUNTA function counts the number of cells in a range that are not empty. It does not matter whether the value is text, a number, a date, or contains an error.
16. What is the shortcut to getting today's date and current time in Excel?
The shortcuts are:
Today’s Date: CTRL + ;
Current Time: CTRL + SHIFT + ;
17. What is Data Validation and how to apply in Excel?
Data Validation is one of the Excel features through which we can restrict the user from entering the wrong data into Excel.
For example: Using the Data Validation feature, we can stop the user from entering any future dates in Excel, stop the user from inserting any duplicate values, and many more.
Data Validation Shortcut: ALT + A + V + V
Data Validation Navigation: Data Tab > Data Tools Section > Data Validation list > Data Validation
18. What are the limitations of VLOOKUP formula?
The VLOOKUP formula has the main 2 limitations:
- It cannot search for the value to the left.
- It works perfectly for unique values but not for duplicates.
19. What is the difference between FIND and SEARCH formula?
The Find and Search functions help in finding the starting position of a text within a cell value (Check the position from left to right).
The only difference is that the Find function is case-sensitive, whereas the Search function is not.
20. What is the difference between SUMIF and SUMIFS function?
The SUMIF and SUMIFS functions are useful for calculating the total of a column based on a condition.
The difference is that we can only use a single condition in the SUMIF function, whereas we can use multiple conditions in the SUMIFS function.
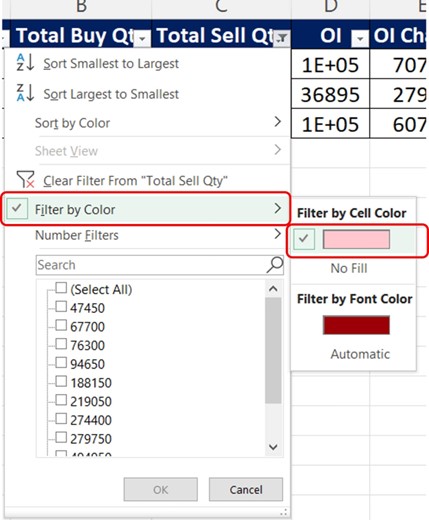
21. How can I get a list of the cells that have been coloured by conditional formatting?
It is very easy to get the list of cells that have been colored by conditional formatting.
You need to follow the below steps:
- Apply Filter(Shortcut: Ctrl + Shift + L)
- Select the Filter by Color option
- Select the color which has been applied to that column
Please see the screenshot below for reference.
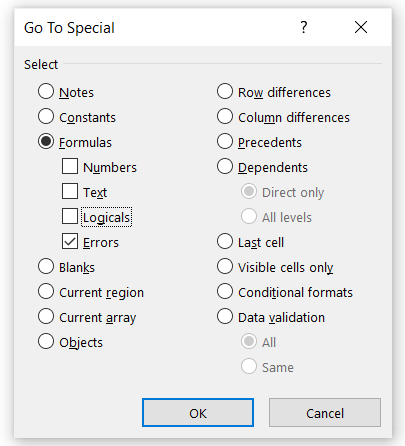
22. How to select all cells in a range containing a formula but displaying an error?
Follow the below steps:
Step 1: Choose the range from which you wish to select errors.
Step 2: Press F5 shortcut key to open GO TO dialogue box
Step 3: Click on Special button
Step 4: Check Errors box from Formulas option
Please see the screenshot below for the reference.
23. What is the Excel shortcut to open Find and Replace dialogue box directly?
The shortcut are as follows:
Ctrl + F: It will open the Find and Replace dialogue box, find tab selected.
Ctrl + H: It will open the Find and Replace dialogue box, replace tab selected.
24. How to hide or unhide all excel sheets?
Follow the below steps:
Step 1: Click on File tab
Step 2: Select the last option “Options”
Step 3: Click on Advanced section
Step 4: Scroll down to the below section “Display options for this workbook”
Step 5: Check the Show sheet tabs box to unhide the sheets and uncheck to hide the sheets
25. Write a formula that will return YES if the cell is blank, otherwise NO?
We will use IF function because condition is given here.
Suppose the reference is from A1 cell then the Formula will be
=IF(A1=””,”Yes”,”No”)
26. How can we only count text values in a range?
We need to use the COUNTIF formula here because we need to count the number of cells that must only contain text values.
=COUNTIF(range,”*”)
27. What is the shortcut to add emojis in Excel ✅😉😊😁?
To get the emojis, press Window Key with semi colon (;). This is not a excel based feature, it is a window-based feature. So, you can use this option on any application if you have windows installed.
28. What is VBA?
VBA stands for Visual Basic for Applications. It is the programming language which is used in Microsoft office products (Excel, Word, Power Point, etc) to automate their manual tasks.
29. What steps are involved in any analytics project?
There are 5 steps in any of the analytical project which are as follows:
- Understand the problem
- Collect raw data related to the problem
- Cleaning of raw data
- Analysing data using graphs and charts
- Interpreting Results / Provide Insights
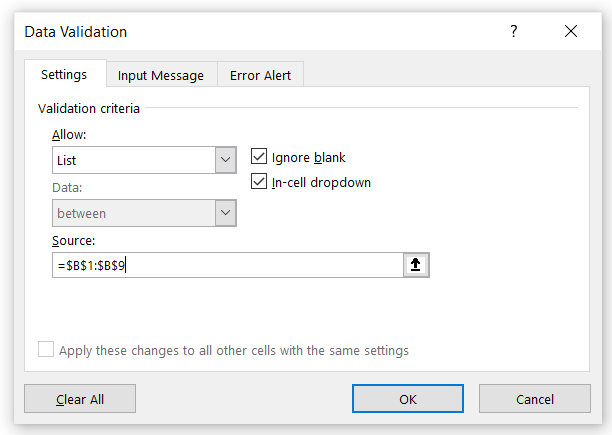
30. How do you add a drop-down list in Excel?
Follow the below steps:
Step 1: Click on Data Tab
Step 2: Click on Data Validation option from Data Tools section
Step 3: Change the option from Any Value to List in Allow option
Step 4: Click in Source and select the excel list for the drop-down list
Step 5: Click on OK button
Please see the screenshot below for the reference.
Click here to watch Excel videos
For any feedback contact us or write an email at support@mdatafinnovatics.com